Program Designs
Structure chart
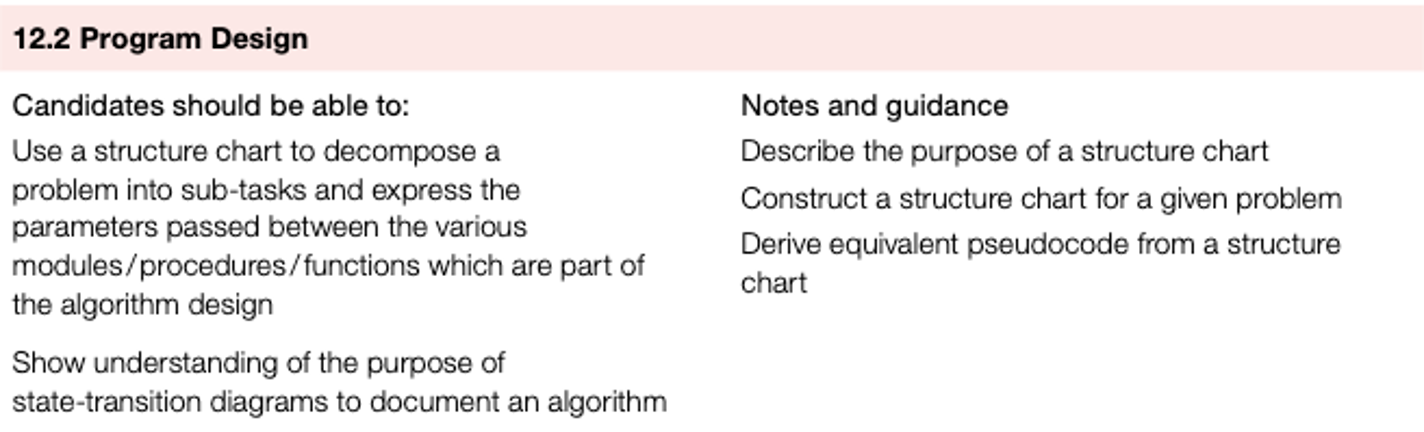
A structure chart is a modelling tool used in program design to decompose a problem into a set of sub-tasks.
The structure chart shows the hierarchy or structure of the different modules and how they connect and interact with each other.
Each module is represented by a box and the parameters passed to and from the modules are shown by arrows pointing towards the module receiving the parameter.
Each level of the structure chart is a refinement of the level above.
A structure chart for converting a temperature from Fahrenheit to Celsius.
The top level shows the name for the whole task that is refined into three sub-tasks or modules shown on the next level.
Selection
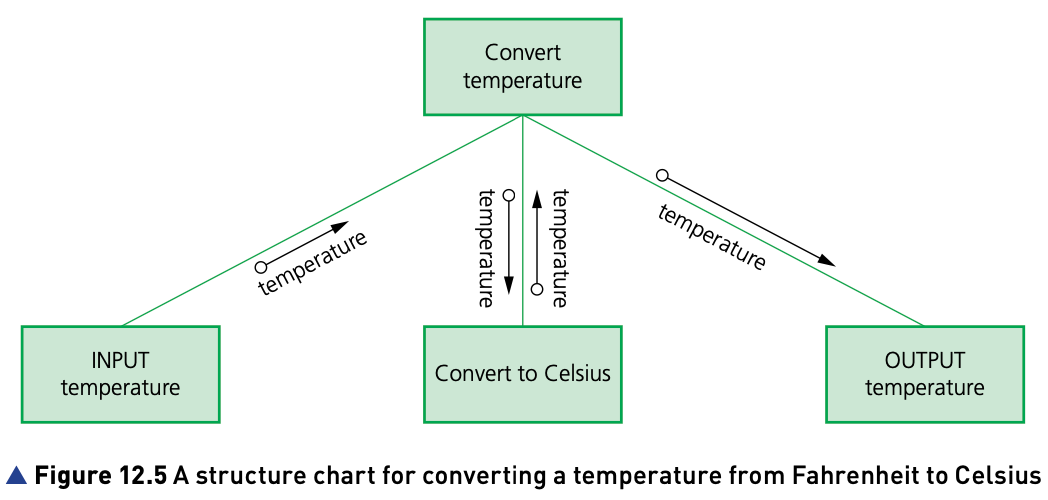
- Structure charts can also show selection.
- The temperature conversion task above could be extended to either convert from Fahrenheit to Celsius or Celsius to Fahrenheit using the diamond shaped box to show a condition that could be true or false.
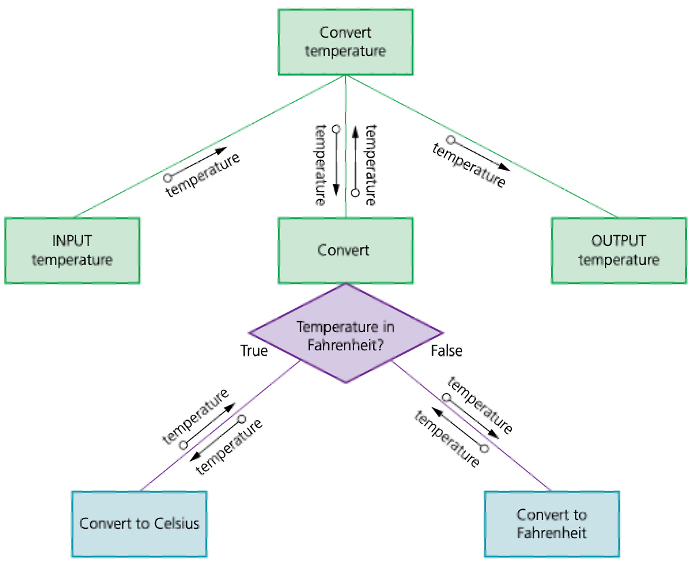
Repetition
- Structure charts can also show repetition.
- The temperature conversion task above could be extended to repeat the conversion until the number 999 is input.
- The repetition is shown by adding a labelled semi-circular arrow above the modules to be completed.
Once a structure chart has been completed, it can be used to derive a pseudocode algorithm.
Structure chart
A is a modelling tool used in program design to decompose a problem into a set of sub-tasks
Finite state machine (FSM)
- A finite state machine (FSM) is a mathematical model of a machine that can be in one of a fixed set of possible states.
- One state is changed to another by an external input, this is called a transition.
- A diagram showing the behaviour of an FSM is called a state-transition diagram.
State-transition diagrams
State-transition diagrams show the conditions needed for an event or events that will cause a transition to occur, and the outputs or actions carried out as the result of that transition.
State-transition diagrams can be constructed as follows:
- States are represented as nodes (circles).
- Transitions are represented as interconnecting arrows.
- Events are represented as labels on the arrows.
- Conditions can be specified in square brackets after the event label.
- The initial state is indicated by an arrow with a black dot.
- A stopped state is indicated by a double circle.
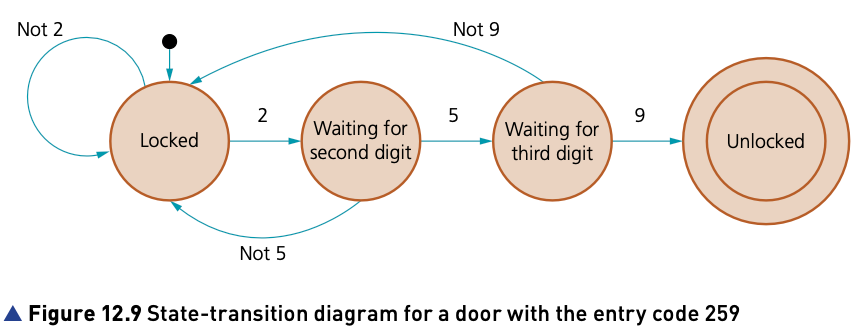
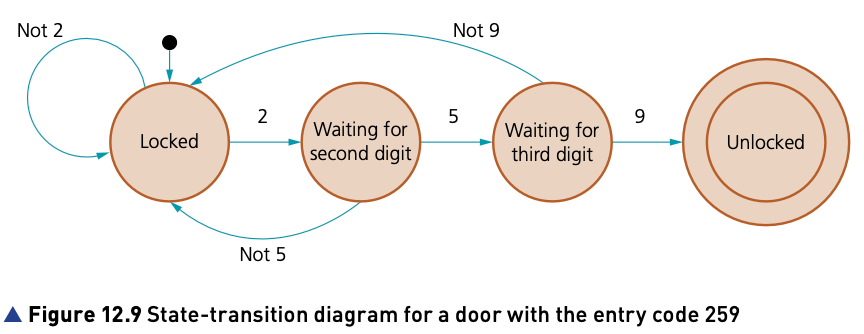
The algorithm for unlocking a door using a three-digit entry code can be represented by a state-transition diagram.
If the door is unlocked with a three- digit entry code, the lock can be in four states
- locked and waiting for the input of the first digit
- waiting for the input of the second digit
- waiting for the input of the third digit
- unlocked.
If an incorrect digit is input, then the door returns to the locked state.
The algorithm halts when the door is unlocked.
A state-transition table shows every state, each possible input and the state after the input.
The state-transition table for a door with the entry code 259 is shown below.
| Current state | Event | Next state |
|---|---|---|
| locked | 2 input | waiting for input of 2nd digit |
| locked | not 2 input | locked |
| waiting for input of 2nd digit | 5 input | waiting for input of 3rd digit |
| waiting for input of 2nd digit | not 5 input | locked |
| waiting for input of 3rd digit | 9 input | unlocked and stopped |
| waiting for input of 3rd digit | not 9 input | locked |
Finite state machine (FSM)
A is a mathematical model of a machine that can be in one of a fixed set of possible states